Law of Supply and Demand
The law of supply and demand is the basic principle on which a market economy is based. This principle reflects the relationship between the demand for a product and the quantity of that product offered, taking into account the price at which the product is sold.
Thus, according to the market price of a good, suppliers (sellers) are willing to produce a certain number of that good. Just as the demanders (buyers) are willing to buy a certain quantity of that good, depending on the price.
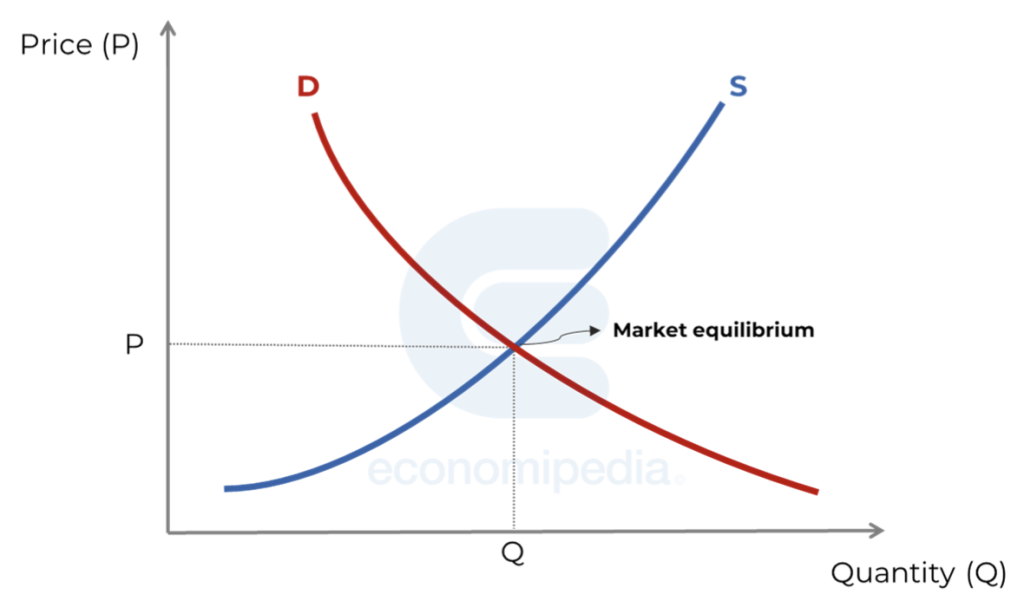
The point where there is an equilibrium because the demanders are willing to buy the same units that the suppliers want to produce, at the same price, is called the market equilibrium or equilibrium point.
According to this theory, the law of demand states that, holding everything else constant (ceteris paribus), the quantity demanded of a good decreases when the price of that good increases. On the other hand, the law of supply states that, holding everything else constant (ceteris paribus), the quantity of a good offered increases when its price increases.
Thus, the supply and demand curves show how the quantity supplied or demanded changes, respectively, as the price of the good varies.
How is the break-even point reached?
In order to understand how the break-even point can be reached, it is necessary to talk about two situations of excess:
- Excess supply: When there is excess supply, the price at which the products are being offered is higher than the equilibrium price. As a result, the quantity offered is greater than the quantity demanded. Consequently, suppliers will lower prices to increase sales.
- Excess demand: On the opposite side, when there is a shortage of products, it means that the price of the offered goods is lower than the equilibrium price. The quantity demanded is greater than the quantity offered. So, the suppliers will increase the price, since there are too many buyers for too few units of the good, to decrease the number of buyers, and establish the equilibrium point.
Graphical representation of the law of supply and demand
Translating the behaviors of supply and demand that we just explained above into a graph, it is understood that the supply curve (S, blue line) is upward sloping and the demand curve (D, red line) is downward sloping. The point where they intersect is known as the market equilibrium.
In a situation where the initial point of demand is at quantity Q1 for a certain price P1, and due to some external cause, there is an increase in demand up to quantity Q2, the price of the good will increase and reach P2.

If, on the contrary, the sellers decrease their production due to some reason (for example, floods cause a decrease in wheat production), we will observe a leftward shift of the supply curve (S) on the graph, and thus, the price of the good in question will increase, and with it, demand will be reduced.

How does competition affect the law of supply and demand?
As we have seen in the examples above, depending on the movement of supply and demand, prices can be affected. In some cases, if the supply or demand for a good is very strong, it can affect the price of that good.
Types of competition
- Perfect competition: This is a quasi-ideal economic situation that is unlikely in reality. It is a market in which the market price arises from the interaction between companies or individuals who demand a product and others who produce and offer it. None of the agents can influence the price of the good or service, that is, they are price-takers.
- Imperfect competition: Individual sellers have the ability to significantly affect the market price of their products or services. We can distinguish according to the degree of imperfect competition:
- Monopolistic competition: There is a high number of sellers in the market, although they have some power to influence the price of their product.
- Oligopoly: The given market is controlled by a small group of companies.
- Monopoly: A single company dominates the entire market of a type of product or service, which usually results in high prices and a low quality of the monopolized product or service.
- Oligopsony: This is a type of market where there are few buyers, although there may be a large number of sellers. Therefore, the control and power over prices and purchasing conditions in the market, resides with the demanders or buyers.
- Monopsony: This is a market structure in which there is only one buyer. While there may be one or several sellers.
Let us see graphically when competition is not perfect and sellers can affect the price of the good. For example, if the supply (S) reduces its production forcibly, it will cause an increase in the price of the good in question, and the demand for that good will be reduce.
Producer surplus and Consumer surplus
Through the law of supply and demand, producers and consumers can find out at what price they are willing to buy a good or service. The difference between the market price and what they are willing to pay or charge is known as the consumer surplus and the producer surplus, respectively.
The graph of the surpluses is as follows:

An example of the law of supply and demand
Let us assume that we own a company that manufactures wooden chairs. We start from the market equilibrium point mentioned earlier. We consider a scenario for the supply and another for the demand.
In the case of supply, let us imagine that a tax is imposed on producers of wooden goods. In this way, the supply will shift to the left, changing the price and reducing the number of chairs sold.

On the demand side, we suppose that customers modify their consumption preferences. From this point on, they will prefer to buy plastic chairs due to their lightness and low cost. In this case, the demanded quantity will decrease and the price will drop.

Autores
Publicado por Andrés Sevilla Arias (CFA) el 16 febrero 2023.
Revisado por última vez el 16 febrero 2023.
Cómo citar este artículo
Sevilla Arias, A. (2023). Law of Supply and Demand. Economipedia. https://economipedia.com/definiciones/law-of-supply-and-demand.html
Sobre Economipedia
Este artículo forma parte de la enciclopedia de Economipedia, una plataforma de educación financiera que ayuda a millones de personas a entender la economía, aprender a invertir y mejorar sus finanzas personales. Fundada en 2012 por Andrés Sevilla Arias y desarrollada por más de 50 economistas y asesores financieros.
Todavía no hay comentarios
Hay 2 tipos de personas: las que leen y se van…y las que dejan huella 👇


